including nuclear, hydro, wind, natural gas, and solar to meet its energy needs.
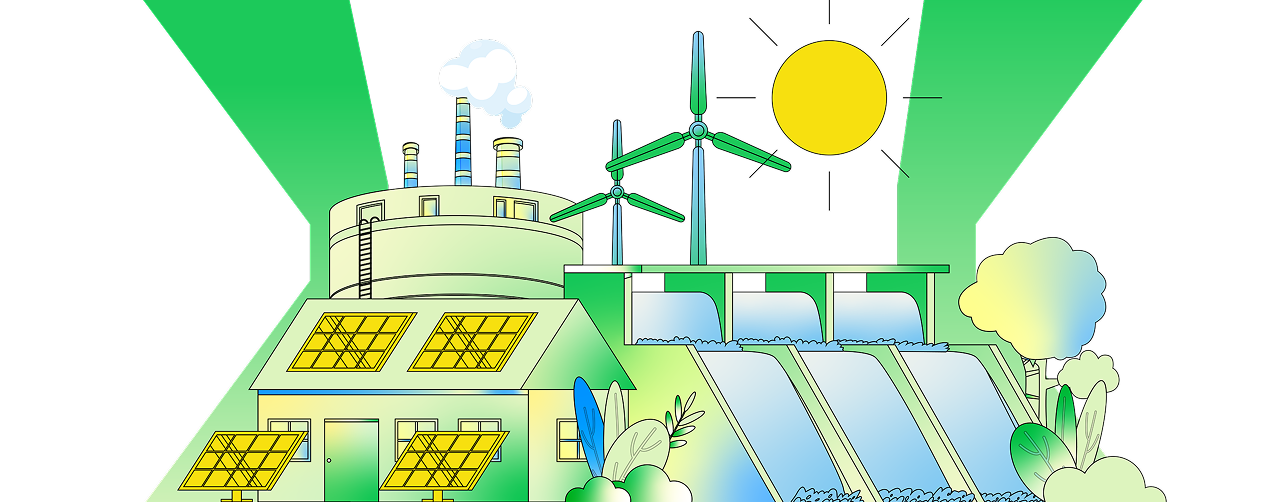
including nuclear, hydro, wind, natural gas, and solar to meet its energy needs.

Each source generates electricity differently and has its own unique characteristics, whether it's reliable like nuclear and hydro, flexible like natural gas, or renewable like wind and solar.
As Ontario transitions to cleaner forms and increased levels of electricity production, understanding these characteristics is key to guiding investments.
By maintaining a diverse energy supply mix, Ontario can effectively ensure a reliable, flexible, and clean electricity system.
Check out the many differences between these leading sources of electricity in Ontario.
Select a source to begin.
Nuclear fission boils water creating steam that turns turbines, generating electricity.
FLEXIBLE & RELIABLE
RELIABLE, NOT FLEXIBLE
RENEWABLE
NO
GREENHOUSE GAS EMISSIONS
VERY LOW
LAND USE
LOW
WASTE PROFILE:
HIGH (while low in waste volume per MWh of electricity produced, it requires very special handling and storage for the radioactive waste)
Flowing water turns turbines, generating electricity.
FLEXIBLE & RELIABLE
BOTH
RENEWABLE
YES
GREENHOUSE GAS EMISSIONS
VERY LOW
LAND USE
LOW-MEDIUM
WASTE PROFILE:
LOW (100 year + asset life)

Burning natural gas boils water creating steam that turns turbines, generating electricity.
FLEXIBLE & RELIABLE
BOTH
(QUICKLY ADJUSTABLE)
RENEWABLE
NO
GREENHOUSE GAS EMISSIONS
HIGH
LAND USE
LOW
WASTE PROFILE:
LOW (Not including emissions)

Wind turns turbines, generating electricity.
FLEXIBLE & RELIABLE
NO
(WEATHER DEPENDENT)
RENEWABLE
YES
GREENHOUSE GAS EMISSIONS
VERY LOW
LAND USE
MEDIUM-HIGH (Variable)
WASTE PROFILE:
MEDIUM (Repaired often, composite materials go to landfill)
Sunlight reacts with materials in photovoltaic (PV) solar cells, generating electricity.
FLEXIBLE & RELIABLE
NO
(WEATHER DEPENDENT)
RENEWABLE
YES
GREENHOUSE GAS EMISSIONS
LOW (~2x hydro)
LAND USE
MEDIUM
WASTE PROFILE:
MEDIUM (Replaced often, small amount of toxins requires special handling)

Burning waste wood pellets boils water creating steam that turns turbines, generating electricity.
FLEXIBLE & RELIABLE
BOTH
(QUICKLY ADJUSTABLE)
RENEWABLE
YES
GREENHOUSE GAS EMISSIONS
LOW (net = 0)
LAND USE
LOW-MEDIUM
WASTE PROFILE:
LOW (uses waste product from agriculture, forestry, paper industry, etc. to make electricity)
A 24/7 economy like Ontario needs a flexible, affordable, and reliable electricity grid—one that can meet the baseload needs but also ramp up quickly when demand increases daily or seasonally.

THE MINIMUM AMOUNT OF ENERGY NEEDED TO KEEP THE GRID OPERATIONAL
In Ontario, nuclear and hydro can generate a constant, steady supply of electricity—24 hours a day, 7 days a week. The output of these generating stations is consistent, reliable and rarely changes. Because of these characteristics, nuclear and hydro are typically the first electricity sources used to meet Ontario's electricity needs.

THE TOP-UP NEEDED TO SUPPLY EXTRA ELECTRICITY DURING PERIODS OF HIGH DEMAND
In Ontario, flexible hydro and natural gas electricity generation can adjust its output to ramp up or down quickly as demand and supply from intermittent renewables (wind and solar) rises and falls throughout the day, like during those summer heatwaves. The ability to match supply to demand is critical to a stable, reliable system.

WEATHER-DEPENDENT ELECTRICITY SUPPLY
In Ontario, wind and solar can offer low-carbon generation. However, as these sources are weather-dependent, they generate more or less electricity based on how sunny or windy it is, which is always changing.

RENEWABLE GENERATION
When a naturally occurring energy source is self-replenishing, we call that source renewable.
The power of the wind, the sun, running water, and burning vegetation can be harnessed to create electricity without depleting that resource.
Ontario plans to add significant new solar and wind generation capacity to the grid. Together with planned refurbishments of huge hydroelectric infrastructure like the Niagara Falls’ Sir Adam Beck facility and work to extend the life of these facilities by an additional 30 years or more, we can ensure that renewables such as solar, wind, and water play a big role in our electricity grid.

NON-RENEWABLE GENERATION
When an energy resource cannot be replaced by natural means at a pace that keeps up with consumption, we call that resource non-renewable.
Carbon-based fossil fuels like coal, oil, and natural gas are non-renewable energy sources. These resources took millions of years to form, and once they are used up, they cannot be replaced. While we have eliminated coal from our electricity grid, natural gas still made up about 13% of Ontario’s total non-renewable electricity generation in 2023.
As Ontario expands its nuclear and renewable energy generation capacity, natural gas will remain a critical energy source in the energy supply mix. Why? Because it still offers a very flexible form of electricity generation that can increase or decrease output within minutes to meet sudden or unexpected changes in supply and demand as well as periods of low wind and solar generation. Gas will continue to play a critical role in the electricity system until new nuclear, wind, hydro, and solar sources come online.
Energy has been critical to human progress over the last few centuries. But no energy source is completely safe. All have short-term impacts on human health, and some can also have long-term impacts by contributing to climate change.

Greenhouse Gas (GHG) Emissions
The proportion of GHG emissions produced by non-renewable and renewable sources varies for the production life cycle stage (extraction, construction, manufacturing, operation, decommissioning) of production. For fossil-fuelled technologies, like natural gas, fuel combustion during operation of the facility emits the majority of GHGs.
For nuclear and renewable energy technologies, the majority of GHG emissions are produced during the construction and manufacturing stages. For nuclear power, fuel processing stages are most important, and a significant share of GHG emissions is associated with construction and decommissioning. For other renewable technologies, most lifecycle GHG emissions stem from component manufacturing and, to a lesser extent, facility construction. For example, in hydro generation facilities with biomass decay and in wind and solar energy generation facilities, GHGs are emitted during construction and decommissioning phases.

That said, fossil fuels emit the most greenhouse gases per unit of energy produced.
Despite its high greenhouse gas emissions, natural gas generation will have to remain a critical component of our electricity grid to ensure reliability and affordability until new low-carbon generation facilities come online and refurbishment of existing low-carbon generation facilities is completed in the coming decades.
The reduction in greenhouse gas emissions, which will be enabled through decarbonization across other sectors like transportation and steel manufacturing, will far outweigh the increased emissions in the electricity sector from continued use of natural gas generation.

OTHER EMISSIONS AND HEALTH IMPACTS
Besides greenhouse gases, energy generation processes and facilities can also produce other emissions that have devastating environmental impacts.
Nitrogen and sulphur dioxides, for example, have caused acidification and eutrophication in ecosystems on our planet, disrupting the natural balance of life on Earth. And still, many more negative impacts are being caused by chemical compounds like 1,4-dichlorobenzene and high levels of photochemical ozone, which can be highly toxic to humans and crops.
Wind power generation is estimated to have comparatively higher environmental and health impacts from these emissions which can be released during all stages, from manufacturing to decommissioning. In nuclear power generation, all life cycle stages, including manufacturing, mining, milling, and construction, are also found to be significant contributors to environmental and human health.
Whether it’s natural gas, nuclear, or renewables, every energy source takes up land, uses water, and needs some natural resources for fuel or manufacturing.

How do these energy sources stack up when it comes to land use? It is difficult to directly compare, given how vastly different each energy source is. But there are some key things to note when it comes to total land use.
First, the amount of space or land covered. How much space does a natural gas or nuclear power plant take up in an area? How much land is covered by solar panels or wind turbines?
Next, the land used for plant operation, to mine energy fuels and materials for construction, and the land used to manage the waste that is produced. To compare the total land use of an energy source, you must consider the entire lifecycle, from manufacturing to decommissioning.
Nuclear energy and natural gas power plants are at the low end of land use. Solar ranks higher in land use needs. For hydroelectricity, land use can be variable ranging from low to high, depending on the size of the flood plain and the reservoirs. Wind farms can have highly variable land use numbers. Since the land between turbines can be used for other activities like farming, the spacing of wind turbines can affect total land use numbers.
Even within a single energy source, there can be wide ranges depending on the material used and the context. For example, solar panels made from cadmium use less materials than silicon panels, and therefore, use less land per unit. The density and spacing of panels, as well as where they have been installed, whether on rooftops or on the ground, can also impact total land use.

In addition to land use, the terrain—including elevation, slope, and natural formations—also influences which energy sources can be utilized.
For example, the best places to harvest solar energy are regions with high sunlight exposure and minimal shading. The ideal locations for wind turbines are sites where the wind speed averages at least 14 to 20 km/h. Hilltops, open plains, and mountain passes are all well-suited to turbine installations as winds are strong and unobstructed. And, although Ontario produces about 25% of its electricity from hydropower, it is much less than other provinces like Quebec and Manitoba due to lack of ideal terrain for hydroelectric plants.
All forms of electricity production generate waste. And all this waste, from greenhouse gas emissions and radioactive waste to end-of-life wind turbine blades and solar panels, need to be properly controlled and managed.
Ontario has strict protocols in place to help reduce production of waste and to manage it.
")
When it comes to managing radioactive waste, Ontario maintains the highest standards at its three nuclear generating facilities.
Each facility stores its used nuclear fuel in dry storage buildings designed to keep people and the surrounding environment safe.
There are also processes in place to reduce production of waste at the source and reduce volumes through sorting, processing, and recycling. In addition, plans are underway to develop a Deep Geological Repository (DGR) for long-term storage of high-level nuclear waste.
By adding new nuclear, renewable generation, and storage sources to the expanding electricity grid, Ontario is on a path to further reduce GHG emissions. Another emerging technology, carbon capture, could help reduce emissions generated by the continued use of natural gas during this period of transition from non-renewable to nuclear and renewable energy generation.
 (1)")
There are different waste products and considerations for wind and solar generation.
A large proportion of the wind turbines can be recycled at the end of their life, but the blades are made up of composite materials—and this ends up in landfills.
Solar panels can contain small amounts of toxins like lead and cadmium, which means they require special waste management processes. With renewable generation technologies, the waste management of the rare and precious earth and specialty metals that are used to build critical components of wind turbines, hydroelectric turbines, and solar panels, becomes vital.
Another aspect to consider in comparing waste profiles is the asset life of the different generation technologies. Asset life is a measure of the number of years an asset will remain in usable condition or functioning order. Asset lives for nuclear (60 years) and hydro (100+ years) are much longer than renewables like wind and solar (20-30 years). Shorter asset lives means more waste.